- Revenues reached €2,914 million, with an order intake of €3,029 million
- The recurring EBIT margin was 7.8%
- Net debt dropped to €622 million
- The priority for 2014 is to generate free cash flow with a target objective of €100 million
Once again, Indra has maintained its positive evolution and it has met all the objectives for the year. The company had a profit of €116 million at the end of the year, 13% less than 2012. The recurring EBIT was €226 million, and the recurring EBIT margin was 7.8%. The net debt was €622 million (compared to €634 million for the previous year), achieving the objective of maintaining adequate shareholder remuneration without increasing debt. Throughout 2013, the company has diversified sources of financing and improved the average maturity periods of the financial resources used.
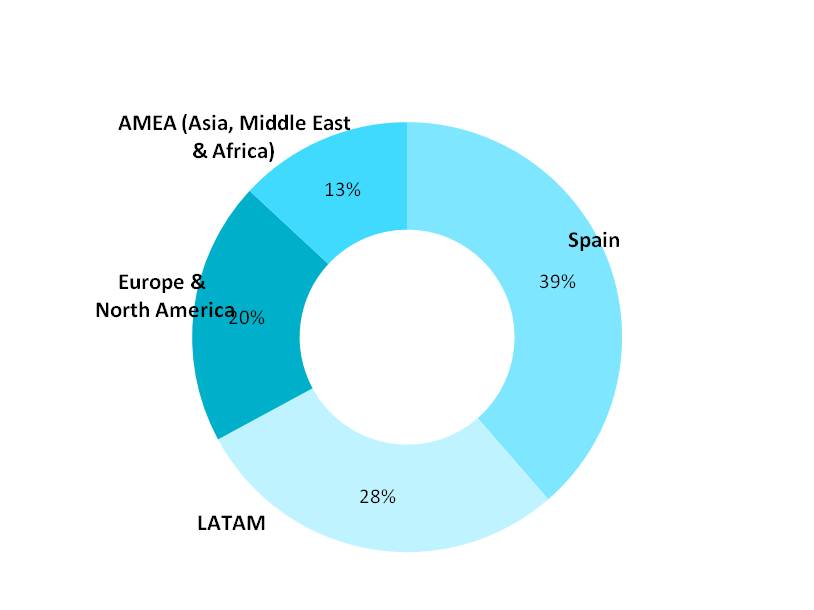
Revenues reached €2,914 million, with a 2% increase in local currency. The reported results (€) were similar to those for the previous year, adjusting the impact of the disposal of the Services business made in 2013 (the advanced management business of digital documentation). Revenues in Spain, the market that represents 39% of total income, fell by 11%, a percentage that is noticeably lower than the 18% drop the previous year. In Latin America, which provides 28% of the company's revenues, they increased by 22% in local currency, 11% reported (€). Europe and North America, which generate 20% of revenues, grew by 10%. Finally, Asia, the Middle East and Africa, which represent 13% of total turnover, marked an 8% drop.
All the vertical markets except for Transport & Traffic had positive growth in local currency, with highlighted results for Energy & Industry (+8%), Security & Defence (+7%) and Financial Services (+6%).
Order intake was 4% greater than revenues. The order book reached €3,493 million, representing 1.2 times the revenues for 2013.
The adaptation and efficiency improvement plan for 2013 has resulted in €28 million in extraordinary costs, in line with what was discussed throughout the year.
The net working capital at the end of the year was equivalent to 109 days of equivalent sales (DoS), within the target range of 100-110 DoS announced to the market at the beginning of the year. Investments (net tangible and intangible assets) reached €64 million, below the €70 million that had been estimated at the beginning of the year. A total of €52 million of free cash flow (FCF) was generated throughout the year.
Over €100 million of free cash flow targeted for 2014
The company's focus and priority are to maintain the process of generating cash flow that marked the years prior to the crisis, which has significantly affected the Spanish market (in 2008 and 2009, the free cash flow generated was 5% of revenues). Therefore, for 2014 the company has set an objective of generating more than €100 million of free cash flow and building a foundation for a progressive improvement in the upcoming years, which will make it possible to continue reducing debt while maintaining an appropriate shareholder remuneration policy.
This objective of generating free cash flow is based on the followingconsiderations: organic growth of positive sales in local currency for 2014, with an order intake level that is similar to revenues; operating profitability levels that are similar to those of 2013; a drop in net working capital; and the development of new state-of-the-art solutions with which to compete in the most demanding markets.
2013 revenues by region
MAIN FIGURES:
|
|
2013 (€M) |
2012 (M€) |
Variation (%) Reported / Local Currency |
|
Order intake |
3,028.8 |
3,193.2 |
(5) / (2) |
|
Revenue |
2,914.1 |
2,941.0 |
(1) / 2 |
|
Backlog |
3,493.3 |
3,470.3 |
1 |
|
Recurrent Operating Profit (EBIT) (1) |
226.2 |
248.8 |
(9) |
|
Recurrent EBIT margin (1) |
7.8% |
8.5% |
(0.7) pp |
|
Extraordinary Cost |
(27.9) |
(31.6) |
(12) |
|
Recurrent Net Profit (1) |
138.0 |
157.3 |
(12) |
|
Net Profit |
115.8 |
132.7 |
(13) |
|
Net Debt Position |
622.5 |
633.3 |
(2) |
(1) Before extraordinary costs